IT_ChartSquare
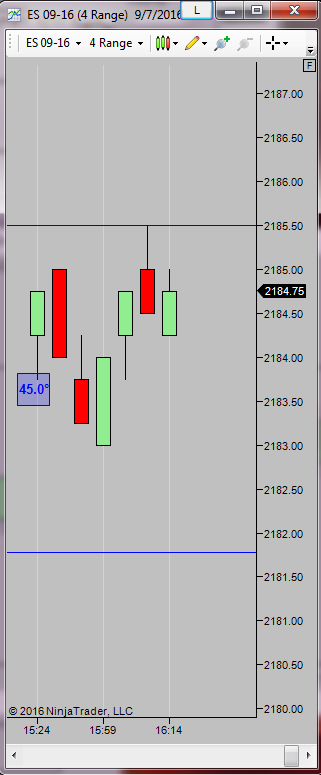
This tool is a visual aid for traders who use Gann, fibs, Point and Figure charts or anything that has angles. Simply load it on the chart and push the toolbar button when you want to use it. The ChartSquare will appear on the left side of the chart and you can then manipulate the right Y axis (or bottom X axis) to visualize your square chart. The ChartSquare shows the X/Y ratio at the top left corner, the visual angle on the top left corner, the Y axis units pixel count on the right and the X axis bar space pixel count on the bottom. Simple move an axis and watch the display. When the box and chart is square the box fill color will change. If the chart centering is enabled you are able to set a percentage of the vertical visible chart to keep the current price action within when the right axis is adjuated to a fixed size. A smaller square box size can be used in order to allow a cleaner chart. If the 'Show Margins' option is used, visible upper and lower lines showing the margins of the percentage of useable chart space for price movement will be seen while adjusting the right axis.
This tool also utilizes the new Tick Adjuster feature to automatically adjust the tool to large charts and Point and Figure charts. This can be overridden and set manually if desired.
Above is an example of the IT_ChartSquare with the IT_HarmonicFan tool.
|
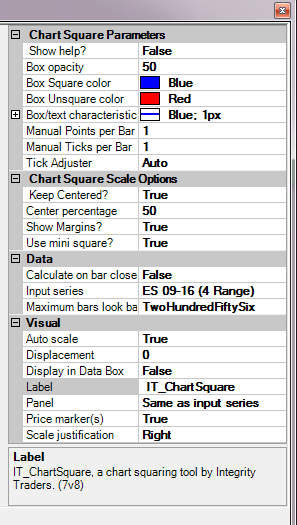
ChartSquare settings with New Centering options. |
 |
| Small square with centering margins while adjusting axis. |
Did you know IT_ChartSquare can reside nicely in another panel if you need to see all of the price panel (since 7v2, 2/17/15)?
- Accurate square charts, every time
- Adjustment for Point & Figure vertical units (ticks per box) and large timeframe charts including new manual overrides using Ticks per bar or Points per bar.
- Adjustable line colors and fills
- Survives chart refreshes and restarts
- Allows current price to be centered in a percentage of chart with fixed axis.
8/21/17 - Added 500x to the manual Tick Adjuster selection.
9/7/16 - Added price centering option.
3/11/16 - Modified the TickAdjuster to be more accurate in Auto mode.
12/24/15 - Removed the Restore Data section in Parameters to save space.
7/29/15 - Fixed issue where sometimes when not connected to data the Square would not immediately appear or disappear on button clicks.
5/8/15 - Added Ticks per bar and Points per bar manual overrides to the Tick Adjuster.
3/10/15 - Updated to work with SodyPointAndFigure charts.
2/17/15 - Modified the indicator to work on non-equidistant bars. It will ne correctly positioned on the secondary chart if applied to it.
9/4/14 - Minor change allowing the shaded area to be grabbed and dragged to scroll the chart.
9/1/14 - Changed the top left ratio to incorporate the tick adjustment being used.
8/30/14 - added product


 IT_CursorGauge
 IT_Analyzer
 IT_QuickTrend
 IT_BarInfo
 IT_ToolBarTime