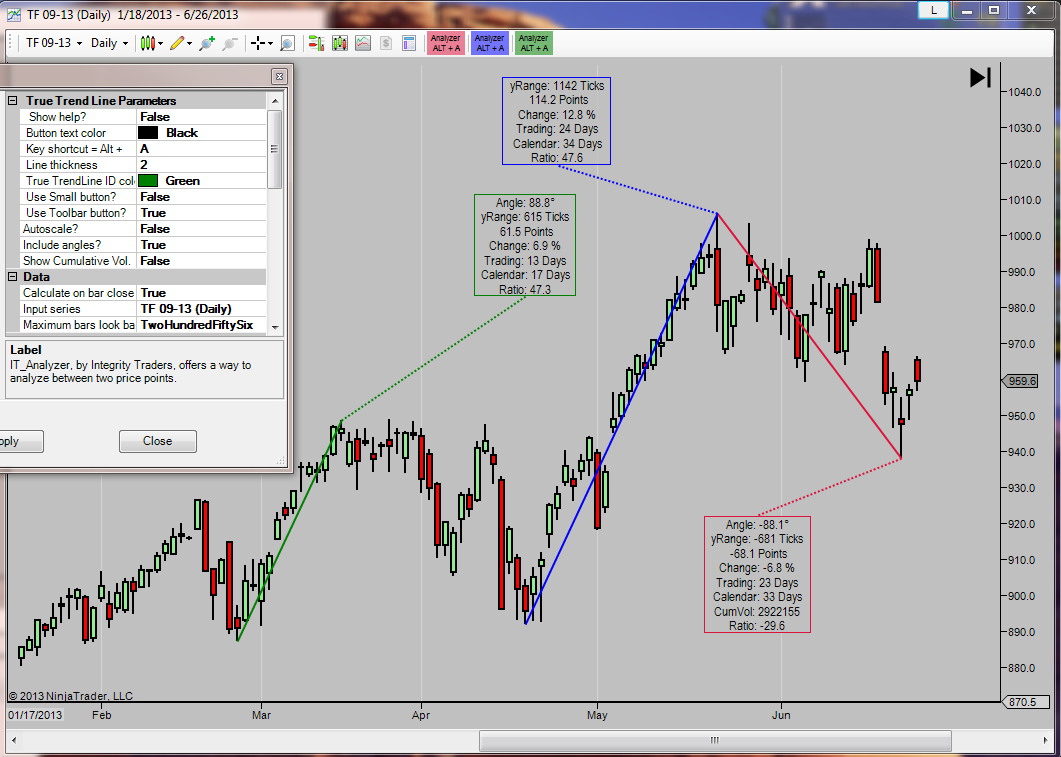
The IT_Analyzer which draws a line similar to the NinjaTrader ruler but displays more information. In addition the data box can be moved anywhere, even after the draw is complete. In addition the its standard data there are some that can be switched off if desired. Those include the line angle and cumulative volume. While drawing the line you will also see a mini data box displaying the line angle and number of bars to aid in the effective placement of your end point. Here is a list of all possible displayed data.
- Angle
- Vertical range in ticks
- Vertical range in points
- Percentage of change
- Number of bars, X range
- Up bars and down bars
- Time spread, if day or 1440 min bars is used the spread is broken down into number of days and number of trading days.
- Cumulative volume
- Value of the vertical range, in ($) dollars
- XY Ratio
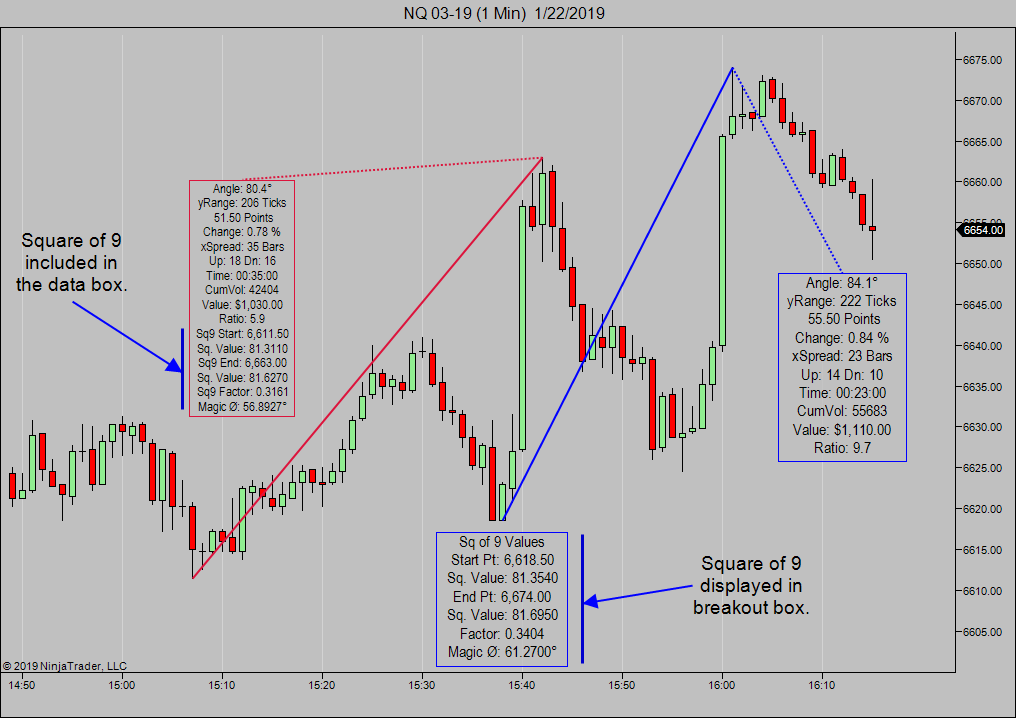
- Square of 9 data group (Jeff Greenblatt Magic Angle)
To use, just click the toolbar button or use the hot key combo, click your start point, then your end point, then your data box location point. Click the end point and drag to a new position if desired, or just move the data box by clicking and dragging it to a new location. Use the quick settings on the button to make instant on/off setting changes. For more information on how to use the draw tools please watch the SpeedLines or GannBox video.
The above charts show the time spread in the data box between the two points on different chart timeframes.
This chart shows the (old) settings and three examples with different data settings.
Here you can see what happens on a 1 tick chart when starting up the next day. The arrows were drawn at the three anchor points on the previous day and upon starting NinjaTrader the next day you can see the arrows have shifted from their original positions. Integrity Traders draw tools will never shift from where they were originally drawn.
IT_Analyzer showing the Square of 9 options in the Data Box or Breakout Box.


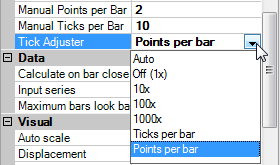
Parameters left, quick settings above, Tick Adjuster below.
More information about the Square of 9 functions and the Jeff Greenblatt Magic Angle can be found on this site: http://www.lucaswaveinternational.com/
1/22/19 -Improved the Auto Scale, added Up bars and Down bars, added Square of 9 data with Magic Angle by Jeff Greenblatt. Square of 9 can be displayed in the Data Box or in a Breakout Box.
3/11/16 - Modified the TickAdjuster to be more accurate in Auto mode.
3/9/16 - Added option to turn off the data bounding box and connector line.
12/24/15 - Removed the Restore Data section in Parameters to save space.
6/24/15 - Reworked the quick setting button, allowed drawing in all directions, enabled cumulative volume on P&F charts.
5/8/15 - Added quick settings from the toolbar button and added more manual override options, Points per bar and Ticks per bar, to the Tick Adjuster.
3/10/15 - Updated to work with SodyPointAndFigure charts.
2/17/15 - Modified the indicator to work on non-equidistant bars.
12/8/14 - Reworked tool to get rid of the little object selector squares place by NinjaTrader on an object that is selected for redragging and redrawing.
10/13/14 - Added option to see treasury notes and some bonds instruments in their native price format or in a decimal tick representation. Instruments include SR, UB, Z3N, ZB, ZF, ZN and ZT.
10/8/14 - IT_Analyzer was updated (non-critical) because on some obscure instruments (ex. ZN, Z7, Q1) with odd tick sizes (ex. .015625, .0078125, .0125) the tool would display decimal prices incorrectly.
8/27/14 - Replaced the P&F Adjust option in the QuickTrend with a Tick Adjuster dropdown. The options in this parameter are:
- Auto - Auto detect P&F as well as large timeframe bars and adjust automatically.
- Off (1x) - No adjustment and 1 tick = 1 tick or vertical unit.
- 10x - Ten ticks = one vertical unit, useful on Daily charts.
- 100x - One hundred ticks = one vertical unit. Useful on Weekly charts.
- 1000x - One thousand ticks = one vertical unit. Useful on Monthly charts.
The angle displayed with this option in use will be labeled SimAngle.
6/17/14 - Fixed a bug where the vRange on instruments with six decimal place tick sizes such as 6J will be shown correctly instead of in scientific notation.
11/22/13 - Added a 'Large Text' option.
11/18/13 - Added a vertical Dollar value option setting. Also now allow toggling of the Angle, Points, Ratio, Cum Vol and Percent change options so you can show only what you need.
11/16/13 - Added settings to turn off bar hi/lo snapping for the first anchor and/or the second anchor point.
9/5/13 - Added a Point and Figure Adjust setting. With this setting set to true (default) the IT_Analyzer tool will calculate the angles and vertical range based on the number of boxes instead of ticks when on a P&F chart. Setting to false will revert the calculations to using the actual tick range.


 IT_QuickTrend
 IT_CursorGauge
 IT_BarInfo
 IT_ToolBarTime